On Some (Fixable) Limitations of 'Understanding the Limitations of Mathematical Reasoning in LLMs'
Time to make statistics great again?
You can also read this on Substack.
Apple’s recent paper “GSM-Symbolic: Understanding the Limitations of Mathematical Reasoning in Large Language Models” [1], has sparked another round of debates on social media about whether (large) language models (LMs) do real reasoning or not.
I chose to present this paper at a reading group last week partly because of the attention it received on social media and partly because I think work on benchmarks is very important and does deserve attention. Whilst I consider the claims and hypotheses around what constitutes “true reasoning” vs “sophisticated pattern matching” a limitation of this paper (a non-fixable one, as the discourse around this topic is both quite subjective and contentious), this post will focus solely on a very fixable limitation: the lack of statistical rigour when evaluating (language) models.
TLDR:
The emphasis on “non-negligible variance” or “increase in variance” throughout the paper appears to be an over-interpretation of normal statistical variation.
Taken individually, for 21 out of 25 models, there isn’t enough evidence to reject the null hypothesis that performance on GSM8K is equal to that on GSM-Symbolic. Of the 4 models where the null can be rejected, 3 perform worse on GSM-Symbolic, and 1 performs better.
Considering all models together, there is some evidence that the overall tendency of models to perform worse on GSM-Symbolic is statistically significant. Whether this is due to data contamination, distributional differences between GSM-Symbolic and GSM8K, “lack of reasoning abilities”, or some other reason, is still to be determined.
Note: My analysis is somewhat constrained by the data and detail presented in the paper. The authors promised to release the benchmark soon, so more rigorous analysis can follow.
Preliminaries (paper summary)
What does the paper do?
Propose a new benchmark: GSM-Symbolic, which generates variants of GSM8K [2] — a well-established benchmark, containing grade school math word problems. GSM-Symbolic is designed to have the same distribution as the original GSM8K dataset. However, GSM-Symbolic is much less likely to have been leaked into model training sets (data contamination). Further, the paper introduces a way to control the difficulty of the questions, giving rise to 3 more datasets (one simpler and two more complex than GSM-Symbolic). A final benchmark, GSM-NoOp, is obtained by introducing “seemingly relevant but ultimately irrelevant” information into GSM-Symbolic.
Evaluate 25 language models: Model families include: Gemma, Phi, Mistral and Llama (open weights), and GPT and o1 (proprietary, OpenAI).
How is the GSM-Symbolic benchmark constructed?
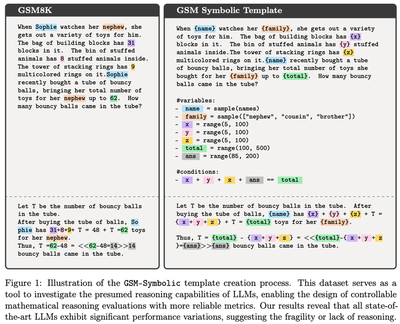
The idea is to create a template for the questions in the original GSM8K dataset by identifying variables whose values can be modified, whilst preserving the structure and logic of the question. For each of these variables a domain of possible values is specified, along with a set of necessary conditions to ensure correctness of the new question and answer. Here’s an example of such a template:

For their analysis, the authors select 100 questions from GSM8K and create such a template for each of them. They then sample 50 realisations from each template. This means that the GSM-Symbolic benchmark consists of 50 datasets of 100 samples each.
In what follows, I will write GSM8K to refer only to those 100 samples from the original GSM8K dataset that were used in the creation of the templates.
What are the results of the analysis?
Compared to GSM8K, performance on GSM-Symbolic drops, suggesting potential data contamination.
As complexity of the questions increases, “the performance [of models] decreases and the variance increases”, which is said to suggest that “models are not performing formal reasoning”, and that the increase in variance is “in line with the pattern-matching hypothesis” (quotes from bottom of page 9).
Models seem to really struggle with No-Ops, suggesting “deeper issues in their reasoning processes” (quote is found in the introduction and conclusion).
What is this post about?
Discuss and quantify “Performance degradation to the original GSM8K accuracy”.
Discuss and quantify “Performance decreases and the variance increases”.
1. Performance degradation compared to the original GSM8K accuracy
The results in support of this conclusion are presented in Section 4.1, which I’m quoting directly, highlighting the key points:
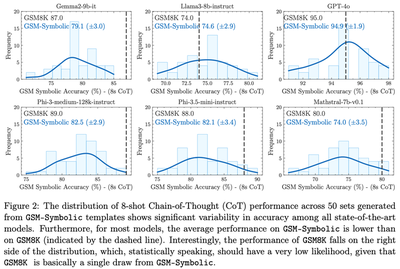
As shown, all models exhibit a non-negligible variance across different sets. […] It is interesting that this variation even exists […]. Another noteworthy observation is that the performance (represented by the dashed line in Fig. 2) on the original questions from the 100 examples of GSM8K used as templates is often more than one standard deviation away from the center of the GSM-Symbolic performance distribution, frequently on the right side of the distribution (this holds for 21 out of 25 models). One explanation for this could be data contamination […]
I see two fixable limitations in this quote:
Lack of statistical rigour: No formal hypothesis is made and tested; rather trivial statistical artifacts are presented as “interesting”, without critical examination.
Lack of an alternative explanation: The obvious plausible cause for the alleged performance discrepancy is a distribution mismatch between GSM8K and GSM-Symbolic.
The second point is something I wanted to examine in more detail, but will leave it for a future post (to say anything definitive would require access to the new benchmarks anyway). Briefly, however, there is some indication that the questions in GSM-Symbolic might be harder than those in GSM8K. In the example template (Figure 1 above), we see that the “total” is sampled from $(100, 500)$, whilst in the original question we have “total=62”. So a more appropriate sampling domain might be $(50, 99)$ rather than $(100, 500)$. This seemingly small change can have a big impact on (some) LM performance due to tokenisation. For Phi-3.5-mini-instruct numbers between $(10, 99)$ use 2 tokens, whilst numbers in $(100, 500)$ use 3 tokens. For Llama3-8b all numbers between $(10, 500)$ use 1 token. These tokenisation nuances might be contributing to increased difficulty in the GSM-Symbolic dataset and potentially explain some of the observed performance discrepancies.
The rest of this section deals with the first point.
Why the observed variation is not (that) interesting
Let’s begin by explaining why the observed variation is not just uninteresting, but actually expected. The GSM8K dataset consists of $N=100$ questions. Each of these questions is answered by 25 different models. It is reasonable to assume that for each model $m=1,…,25$, the answers to these questions are independent and identically distributed (i.i.d.) Bernoulli trials with a model-specific success probability $p_m$.
The total number of correct answers for each model follows a Binomial distribution: $\text{Binomial}(100, p_m)$. The variance of this distribution is fully determined by the success probability $p_m$ and equals $N \cdot p_m \cdot (1-p_m)$. It is well-known and easy to see that this variance is maximised when $p_m=1/2$ and goes to 0 as $p_m$ goes to 0 or 1. (We’ll get to that point again in the next section!)
To quantify what is “normal” variation (and hence uninteresting), we can construct confidence intervals (CI) for the point estimates of pm, which are provided in the second column of Table 1 in the Appendix of the paper. There are different ways to construct CI for the Binomial proportion. The Figure below shows Wilson score intervals. (See Appendix for more results.)
As expected, variation is higher for models with pm closer to 1/2 (e.g. Gemma-7b, Phi-2, Mistral-7b-v0.1), resulting in wider CIs. Conversely, models with pm is closer to 0 (Gemma2b) or 1 (GPT-4o, o1-preview) have substantially narrower CIs.
So far we have not talked about any of the GSM-Symbolic results yet. Before we do, I hope that the above has made it clear that 1) variation in performance is expected and quantifiable, e.g. via confidence intervals; and 2) these confidence intervals are wider when pm is close to 0.5 and narrower when pm is close to 0 or 1.
Let’s now look at Figure 2 of the paper.
Note: The x-axis scales are different for different models (I may write another blog post on the topic of figures and tables).

For the models shown in this figure, the GSM8K accuracy ranges from 74% for the weakest model (Llama3-8B-instruct) to 95% for the strongest model (GPT-4o). The weakest model, Llama3-8B-instruct, shows a much wider variation in accuracy, between ~68% to ~80%. The strongest model, GPT-4o, has a considerably narrower spread, between ~91% to ~98%. For both of these models, the variation in GSM-Symbolic performance falls well within the CIs we calculated above! These are (64.6%, 81.6%) for Llama3-8B-instruct and (88.8%, 97.8%) for GPT-4o. What this means is that the variation in performance for these two models is completely expected and uninteresting.
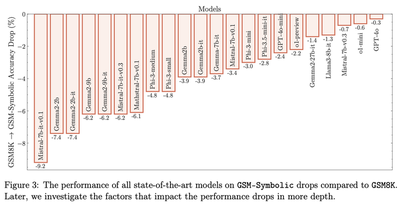
For all other models in Figure 2, the dashed line is in the right tail of the distribution. Additionally, Figure 3 of the paper reports substantial performance decrease for many other models. Can we claim that there is a statistically significant difference in model performance between GSM-Symbolic and GSM8K?

Hypothesis testing
The right tool to answer such questions is a hypothesis test. Specifically, the hypothesis we’d like to test is whether the success probability of models on the GSM8K dataset, denoted pm,8k, is statistically equal to the average success probability on GSM-Symbolic, denoted pm,symb. This is commonly referred to as the null hypothesis. The alternative hypothesis is that the two are different:
$$ H_0: p_{m, 8k} = p_{m, symb} \quad\quad\quad H_A: p_{m, 8k} \neq p_{m, symb} $$
For ease of presentation, I’m going to assume that pm,symb is a fixed, preset value given to us (i.e. not an estimate obtained from another sample; see Appendix for the results wihtout this assumption.).
The statistically inclined reader will know that there’s a correspondence between confidence intervals and hypothesis tests. In short, if the CI computed above includes the value $p_{m,symb}$, we fail to reject the null hypothesis. If $p_{m,symb}$ falls outside the CI, we reject the null in favour of the alternative. Common choices of significance level for statistical test are 5% and 1%.
The results of these hypothesis tests at the 5% significance level can be read from the following chart (the results at the 1% level are included in the Appendix):
We see that there are 4 models for which we are able to reject the null: Gemma-7b, Mistral-7b-instruct-v0.1, Phi-2 and Llama3-8b. Note that the performance of Llama3-8b on GSM-Symbolic appears to be statistically better than on GSM8K (with some minor technicalities on one- vs two-sided tests that I won’t get into here).
This analysis is by no means perfect (e.g. we haven’t discussed things like multiple testing,, which I might do in another post), but it does provide a degree of rigour, which I find increasingly necessary in LLM research. Especially when talking about concepts like “reasoning” that don’t have well-established definitions.
To summarise: analysing models independently, 21 out of 25 models show statistically equivalent performance on GSM8K and GSM-Symbolic.
Paired hypothesis test
A few people correctly pointed out the trend that that many models perform worse on GSM-Symbolic than on GSM8K. To assess the statistical significance of this systematic trend, we can conduct what is known as a paired difference test. The Wilcoxon signed-rank test would be an appropriate one to apply in our case with two important caveats.
Caveat 1: Non-independent data. It will be incorrect to perform the test on all 25 models as these are not independent. There are several types of dependence to consider. Most obviously, the base models and their instruct-tuned version are clearly related (e.g. Gemma2-9b and Gemma2-9b-it). I’d also argue that different sizes within the same model family cannot be considered independent (e.g. mini-small-medium for Phi or 2b-9b-27b for Gemma); minor version updates (e.g. Mistral v0.1 vs 0.3, Phi 3 vs 3.5) will also likely be correlated. So although we have a sample of 25 models, the “effective” sample size is much, much smaller.
Here’s my attempt to come up with independent set of models. In each model family, I’ll take the latest, largest instruct-tuned version. I’ll repeat this by also taking the smallest version. This gives us two sets of 7 models (differences between them are in italics):
Largest subset of models: Gemma2-27b-it, Phi-3.5-mini-instruct, Mistral-7b-instruct-v0.3, Mathstral-7b-v0.1, Llama3-8b-instruct, GPT-4o, o1-preview.
Smallest subset of models: Gemma2-2b-it, Phi-3.5-mini-instruct, Mistral-7b-instruct-v0.3, Mathstral-7b-v0.1, Llama3-8b-instruct, GPT-4o-mini, o1-mini.
Caveat 2: The results of GSM-Symbolic are averages across 50 datasets, whilst GSM8K is based on a single sample. I think we’d want to compare accuracies on GSM8K vs accuracies on each of the 50 datasets (at the time of writing these are not publicly available). I’m still trying to figure out what is the correct way to handle the unbalanced number of samples in this case is (more on this to come).
With those two caveats, here is the hypothesis and results:
$$ H_0: p_{8k} = p_{symb} \quad\quad H_A^\text{two-sided}: p_{8k} \neq p_{symb} ~\text{ or}~ H_A^\text{one-sided}: p_{8k} < p_{symb}, $$ where $p_{8k}=[p_{1,8k}, \dots, p_{7,8k}]$ and $p_{symb}= [p_{1,symb}, \dots, p_{7,symb}]$.
Largest subset of models:
p-value of the two-sided test is 0.046875. This means that we can reject the null at the 5%, but not at the 1%, that there are performance differences between GSM-Symbolic and GSM8K.
p-value of the one-sided test is 0.0234375.
Smallest subset of models:
p-value of the two-sided test is 0.078125, i.e. we cannot reject the null at the 5% or the 1% level.
p-value of the one-sided test is 0.0390625.
To summarise: analysing the results of models jointly, there appears to be some evidence of differences in performance.
2. Performance decreases and the variance increases
The paper highlights this on multiple occasions, most notably in Section 4.3. Some examples include:
[page 3] We show that performance degradation and variance increase as the number of clauses increases, indicating that LLMs’ reasoning capabilities struggle […]
[page 9] the increase in variance suggests that searching and pattern-matching become significantly harder for models as the difficulty increases.
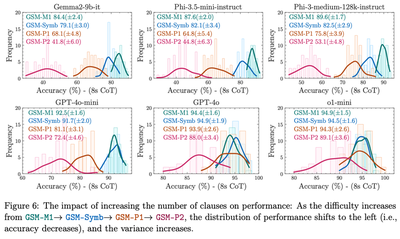
[page 9, Figure 6 reproduced below] the distribution of performance shifts to the left (i.e., accuracy decreases), and the variance increases.

Here we have 4 different datasets: the baseline GSM-Symbolic, an easier version of it (M1) and two harder versions of it (P1 and P2). It is not unreasonable to expect that a model might perform differently on different datasets, for example better on the easier ones and worse on harder ones. We can make a similar assumption as before, namely that the answers a model m gives to questions of difficulty $d=-1, 0, 1, 2$ are i.i.d. Bernoulli trials with success probability $p_{m,d}$. The distribution of the total number of correct answers is then $\text{Bin}(N=100, p_{m,d})$, which has variance $N \cdot p_{m,d} \cdot (1 - p_{m,d})$.
If we happen to have decreasing probabilities of success, i.e. $p_{m,-1} > p_{m,0} > p_{m,1} > p_{m,2} > 0.5$ as is the case for some of the models in Figure 6, then the corresponding variances must increase. Whether or not this decrease in probability of success has any relationship to the “reasoning abilities” of a model is beyond the scope of this blog :)
To summarise: the emphasis on “non-negligible variance” and “increase in variance” throughout the paper appears to be an over-interpretation of normal statistical variation.
Conclusion
There’s huge value in developing new benchmarks and I think the proposed GSM-Symbolic is quite neat and useful! The accompanying analysis, in my opinion, can be substantially improved with the help of basic statistics. Without those we risk over-interpreting results and drawing misleading conclusions.
I never thought I’d be the one advocating for the use of hypothesis tests and p-values, but here we are… When it comes to language models evals, it’s time to make statistics great again!
Cite as
@article{
    ivanova2024gsm,
    title = "On Some (Fixable) Limitations of 'Understanding the Limitations of Mathematical Reasoning in LLMs'",
    author = "Ivanova, Desi R",
    journal = "desirivanova.com",
    year = "2024",
    url = "https://desirivanova.com/post/gsm-symbolic/"
}
References
[1] Mirzadeh, I., Alizadeh, K., Shahrokhi, H., Tuzel, O., Bengio, S., & Farajtabar, M. (2024). GSM-Symbolic: Understanding the Limitations of Mathematical Reasoning in Large Language Models. arXiv preprint arXiv:2410.05229.
[2] Cobbe, K., Kosaraju, V., Bavarian, M., Chen, M., Jun, H., Kaiser, L., … & Schulman, J. (2021). Training verifiers to solve math word problems. arXiv preprint arXiv:2110.14168.
Acknowledgement
I’d like to Momchil Konstantinov and Alex Coca, Ilija Ilievski and Adam Goliński for their feedback on this post.
Appendix
Clopper-Pearson CIs
For robustness purposes, here are the Clopper-Pearson confidence intervals as well:
The Clopper-Pearson CIs are slightly wider than those obtained using the Wilson score. Using Clopper-Pearson would not have changed any of the results presented in this post.
Two-sample binomial proportion test
Strictly speaking, pm,symb is not a fixed number but an estimate computed using another sample. Therefore truly correct test to perform here is a two-sample binomial proportion test: $$ H_0: p_{m, 8k} - p_{m, symb} =0 \quad\quad\quad H_A: p_{m, 8k} - p_{m, symb} \neq 0 $$
Under the null $p_{m, 8k} = p_{m, symb}$ and so we estimate both using a pooled estimate: $$ p_{pool} = \frac{(100 p_{8k} + 5000p_{symb})}{100+5000} \quad \text{SE}(p_{pool}) = \sqrt{p_{pool}*(1-p_{pool}) (1/100+1/5000)}. $$ The test statistic (pm,8k - pm,symb) / SE(ppool) is then approximately normal and is used co compute p-values, which I’ve done in this spreadsheet. The results in this case are exactly the same as before: we are able to reject the null for Gemma-7b, Mistral-7b-instruct-v0.1 and Phi-2 (performing worse), and Llama3-8b (performing better).